Laravel Create Dynamic Bar Chart Using Google Chart API
Hello Artisans, today we'll discuss about how to integrate dynamic bar charts using Google Chart. Google Chart provides various kinds of interactive charts for our website. For more info check here. So, let's see how we can implement our Bar of chart in our Laravel Application using Google Chart API.
Note: Tested on Laravel 9.11.
Table of Contents
Create and Setup Controller
First of all, create a controller so that we can write our logic or query to show the result. So, fire the below commands in the terminal.
php artisan make:controller ChartControllerIt'll create a controller under app\Http\Controllers called ChartController.php. Open the file and replace with below codes.
<?php

namespace App\Http\Controllers;

use App\Models\User;
use Illuminate\Http\Request;

class ChartController extends Controller
{
    public function index(): \Illuminate\Contracts\View\Factory|\Illuminate\Contracts\View\View|\Illuminate\Contracts\Foundation\Application
    {

        try {
            $users = User::selectRaw('DATE(created_at) as date,COUNT(*) as count')->groupBy('date')->get();

            $result[] = ['Date', 'ToTal User'];
            foreach ($users as $user) {
                $result[] = [$user->date,$user->count];
            }
            $data = [
                'users' => json_encode($result),
            ];

            return view('chart', $data);
        } catch (\Exception $e) {
            dd($e);
        }
    }
}
Define Routes
Now we need to put the below routes in our web.php
Route::get('chart', [App\Http\Controllers\ChartController::class, 'index']);Create and Setup blade File
Now we need to create a blade file for viewing the chart in our browser. So, create a file under resources\views named chart.blade.php. And open the file and replace with the following codes.
<!doctype html>
<html lang="en">
<head>
<title>Google Bar Chart | Shouts.dev</title>
<meta charset="utf-8">
<meta name="viewport" content="width=device-width, initial-scale=1, shrink-to-fit=no">
<link rel="stylesheet" href="https://stackpath.bootstrapcdn.com/bootstrap/4.3.1/css/bootstrap.min.css" integrity="sha384-ggOyR0iXCbMQv3Xipma34MD+dH/1fQ784/j6cY/iJTQUOhcWr7x9JvoRxT2MZw1T" crossorigin="anonymous">
</head>
<body>
<div class="container-fluid p-5">
<div id="barchart_material" style="width: 100%; height: 500px;"></div>
</div>
<script src="https://code.jquery.com/jquery-3.3.1.slim.min.js" integrity="sha384-q8i/X+965DzO0rT7abK41JStQIAqVgRVzpbzo5smXKp4YfRvH+8abtTE1Pi6jizo" crossorigin="anonymous"></script>
<script src="https://cdnjs.cloudflare.com/ajax/libs/popper.js/1.14.7/umd/popper.min.js" integrity="sha384-UO2eT0CpHqdSJQ6hJty5KVphtPhzWj9WO1clHTMGa3JDZwrnQq4sF86dIHNDz0W1" crossorigin="anonymous"></script>
<script src="https://stackpath.bootstrapcdn.com/bootstrap/4.3.1/js/bootstrap.min.js" integrity="sha384-JjSmVgyd0p3pXB1rRibZUAYoIIy6OrQ6VrjIEaFf/nJGzIxFDsf4x0xIM+B07jRM" crossorigin="anonymous"></script>
<script type="text/javascript" src="https://www.gstatic.com/charts/loader.js"></script>
<script type="text/javascript">
google.charts.load('current', {'packages':['bar']});
google.charts.setOnLoadCallback(drawChart);
function drawChart() {
var data = google.visualization.arrayToDataTable({!! $users !!});
var options = {
chart: {
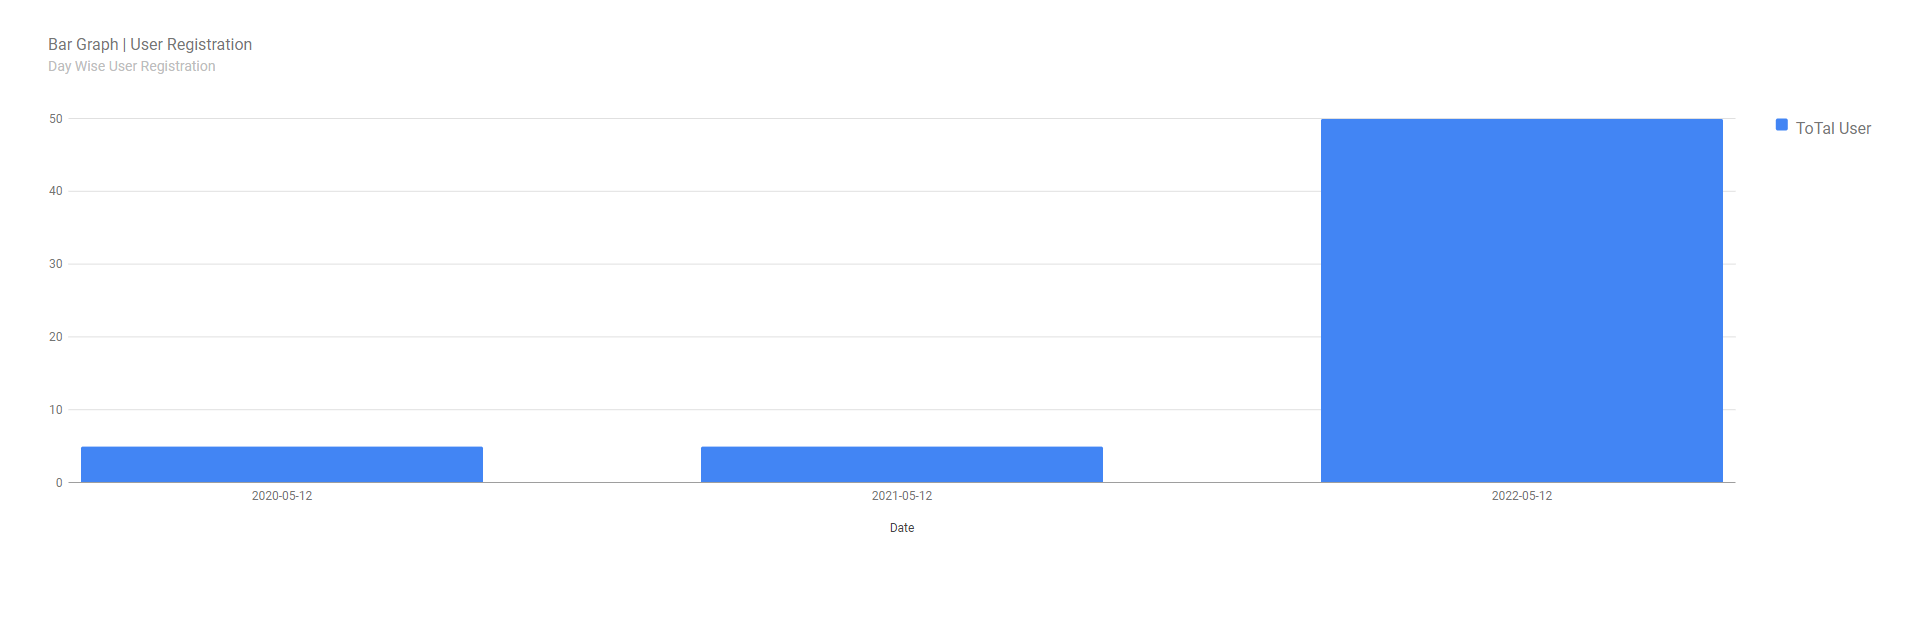
title: 'Bar Graph | User Registration',
subtitle: 'Day Wise User Registration',
},
bars: 'vertical'
};
var chart = new google.charts.Bar(document.getElementById('barchart_material'));
chart.draw(data, google.charts.Bar.convertOptions(options));
}
</script>
</body>
</html>
Create Dummy Records
Now we'll create some dummy records using Tinker. If you're not familiar with tinker, then I'll recommend you to follow one of my short tutorial on Tinker. Now, fire the below commands in terminal
php artisan tinker

User::factory()->count(60)->create()
Output
Now we ready with our setup. It's time to check our output. Now go to http://127.0.0.1:8000/chart, If everything goes well you'll find a below output.
That's it for today. Hope you'll enjoy this tutorial. You can also download this tutorial from GitHub. Thanks for reading. 🙂