How to Use Highcharts with Laravel 8.x
Hello artisans, In this tutorial, I will show you how you can use Highcharts with Laravel. Highcharts is a js library, by which we can use bar chart, line chart, area chart, column chart etc. So, no more talk and let’s get dive into the topic.
Note: Tested on Laravel 8.65.
Table of Contents
Create and Configure Controller
In this step, we firstly create a controller. So, fire the below command in your terminal.
php artisan make:controller ChartController
This will create a controller under app\Http\Controller. Open up this file and paste the below code:
<?php

namespace App\Http\Controllers;

use App\Models\User;
use Illuminate\Http\Request;
use Illuminate\Support\Facades\DB;

class ChartController extends Controller
{
    public function index()
    {
        $users = User::select(DB::raw("COUNT(*) as count"))
            ->whereYear('created_at', date('Y'))
            ->groupBy(DB::raw("Month(created_at)"))
            ->pluck('count');

        return view('chart', compact('users'));
    }
}
Create Route
Put the below route in your web.php
Route::get('chart', [\App\Http\Controllers\ChartController::class,'index']);
Create and Configure View
In this step, first we need to create a blade file under resources/views called chart.blade.php. After creating a file, paste the below code into the file:
<!DOCTYPE html>
<html>
<head>
    <title>Highcharts Example - codechief.org</title>
</head>

<body>

<div id="container"></div>
</body>

<script src="https://code.highcharts.com/highcharts.js"></script>

<script type="text/javascript">
    var users =  @json($users);

    Highcharts.chart('container', {
        title: {
            text: 'New User Growth, 2021'
        },
        subtitle: {
            text: 'Source: codechief.org'
        },
        xAxis: {
            categories: ['January', 'February', 'March', 'April', 'May', 'June', 'July', 'August', 'September', 'October', 'November', 'December']
        },
        yAxis: {
            title: {
                text: 'Number of New Users'
            }
        },
        legend: {
            layout: 'vertical',
            align: 'right',
            verticalAlign: 'middle'
        },
        plotOptions: {
            series: {
                allowPointSelect: true
            }
        },
        series: [{
            name: 'New Users',
            data: users
        }],
        responsive: {
            rules: [{
                condition: {
                    maxWidth: 500
                },
                chartOptions: {
                    legend: {
                        layout: 'horizontal',
                        align: 'center',
                        verticalAlign: 'bottom'
                    }
                }
            }]
        }
    });
</script>
</html>
Create Dummy Data
For creating dummy data, we will use tinker. If you heard for the first time about tinker then I will recommend you to see one of my articles on Tinker. So, fire the below command into your terminal:
 php artisan tinker
//then
App\Models\User::factory()->count(500)->create(
Output
Now if you run your project and go to http://127.0.0.1:8000/chart , then you will find the below output
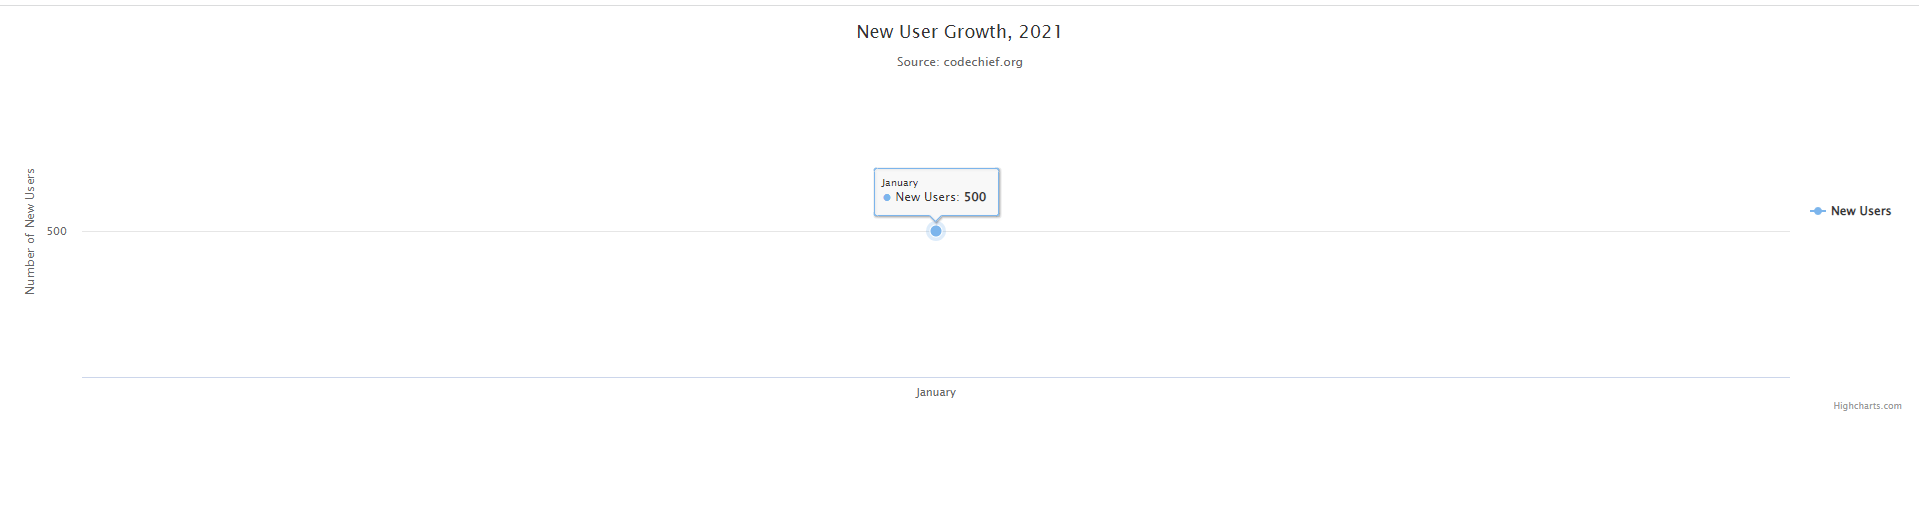
And that’s it, you’ve successfully implemented the Highcharts in your application. You can find more chart’s in the official documentation of Highcharts.
That’s all for today. You can download the project from GitHub also. Thanks for reading.